미리 알아야할 정보
WEB, WAS, 모니터링 PC 는 각각 다른 컴퓨터에 위치하고 있습니다
WEB: 192.168.23.2
WAS: 192.168.23.4
모니터링(Prometheus, Grafana, Docker..): 192.168.23.13
docker 패키지 설치
dnf install -y yum-utils
# Docker 공식 저장소 추가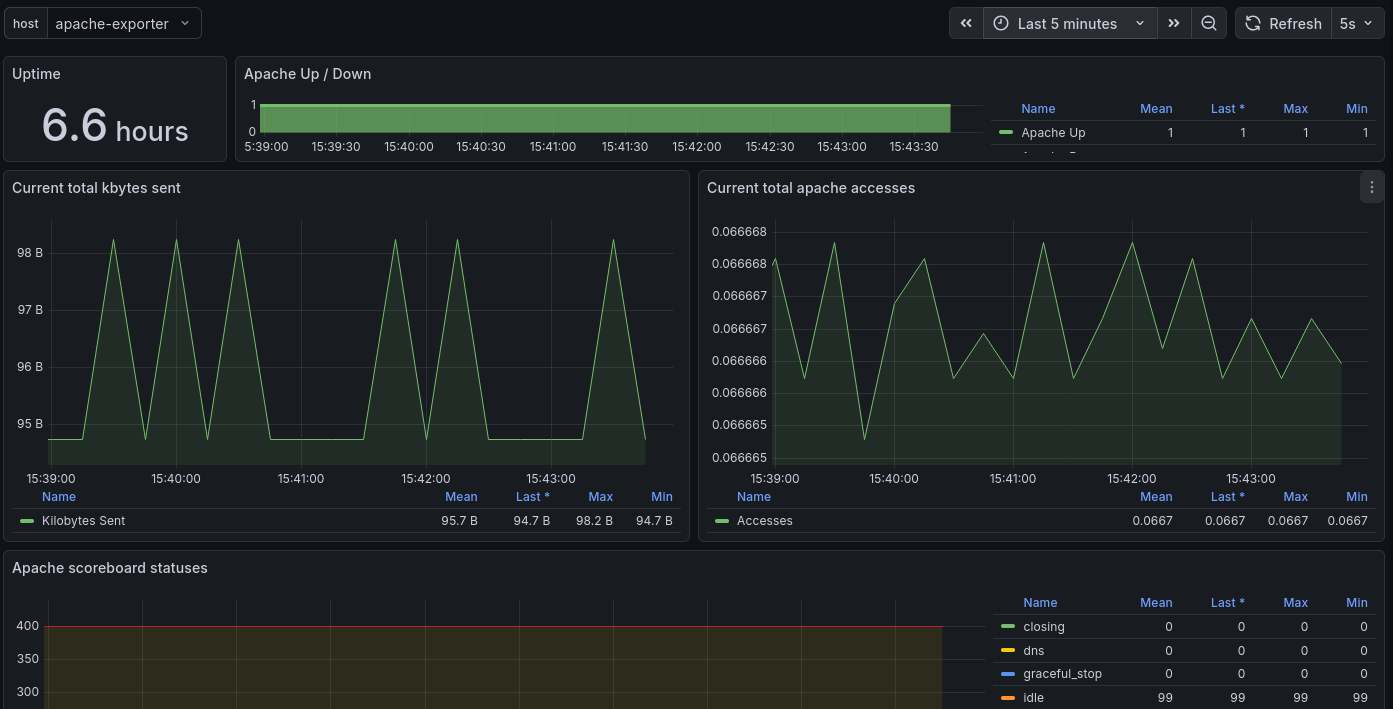
yum-config-manager --add-repo https://download.docker.com/linux/centos/docker-ce.repo
# Docker 엔진 및 Compose 플러그인 설치
dnf install -y docker-ce docker-ce-cli containerd.io docker-buildx-plugin docker-compose-plugin
# Docker 서비스 시작 및 부팅 시 자동 실행 설정
systemctl enable --now dockerdocker 관련 폴더 및 파일 생성
cd /monitoring

# Prometheus 설정용 폴더 생성
mkdir -p ./prometheus

# docker 데이터 저장용 폴더 생성(Prometheus, Grafana)
mkdir -p ./grafana_data
mkdir -p ./prometheus_data

# 파일 생성
touch ./prometheus/prometheus.yml
touch docker-compose.yml

# 모든 권한 허용 (테스트를 위해 임시로 설정)
chmod -R 777 prometheus_data
chmod -R 777 grafana_data
Prometheus docker 파일 생성
~/monitoring/prometheus/prometheus.yml
global:
  scrape_interval: 15s

scrape_configs:
  # apache exporter
  - job_name: 'apache'
    static_configs:
      - targets: ['apache-exporter:9117']

  # 외부 fastapi 사용시 추가
  - job_name: 'fastapi'
    static_configs:
      - targets: ['192.168.23.4:8000']
fastapi targets에 아이피만 작성해도 Prometheus가 데이터를 수집할 수 있는 이유
...
from prometheus_fastapi_instrumentator import Instrumentator
app = FastAPI()
#이 한 줄이면 /metrics 엔드포인트가 생깁니다.
Instrumentator().instrument(app).expose(app)
...
모니터링 대상 서버(WAS)는 단 한 줄의 코드로 데이터를 내보낼 준비가 끝나며, 모니터링 서버(Prometheus)는 그저 해당 서버의 IP 주소를 바라보기만 하면 됩니다
Docker compose 파일 생성
~/monitoring/docker-compose.yml
services:
  # Apache Exporter (Apache 지표를 Prometheus 포맷으로 변환)
  apache-exporter:
    image: bitnami/apache-exporter:latest
    container_name: apache-exporter
    command: --scrape_uri="http://192.168.23.3/server-status?auto"
    restart: always

  # Prometheus (데이터 수집 및 저장)
  prometheus:
    image: prom/prometheus:latest
    container_name: prometheus
    volumes:
      - ./prometheus/prometheus.yml:/etc/prometheus/prometheus.yml
      - ./prometheus_data:/prometheus # 수집된 시계열 데이터 저장
    command:
      - '--config.file=/etc/prometheus/prometheus.yml'
      - '--storage.tsdb.path=/prometheus'
    ports:
      - "9090:9090"
    restart: always

  # Grafana (데이터 시각화)
  grafana:
    image: grafana/grafana:latest
    container_name: grafana
    volumes:
      - ./grafana_data:/var/lib/grafana # 대시보드, 플러그인, 설정 데이터 저장
    ports:
      - "3000:3000"
    environment:
      - GF_SECURITY_ADMIN_PASSWORD=admin # 초기 비밀번호
    restart: always
Docker 컨테이너 내부 설정 파일 수정 (httpd)
- 도커 내부 컨테이너 접속해서 수정 (비추천 휘발성)
docker exec -it <컨테이너 이름> /bin/bash

# vi 편집기가 없을 경우도 있기에 설치 필요
vi /usr/local/apache2/conf/httpd.conf

# vim 편집기 설치
apt-get update apt-get install vim -y- 웹 기본 설정 파일 추출 (추천 영구적)
docker cp apache-server:/usr/local/apache2/conf/httpd.conf ./html/httpd.conf

vi ./httpd.conf
1번의 경우 ~/monitoring/httpd.conf
2번 방법의 경우 /usr/local/apache2/conf/httpd.conf
<Location "/server-status">
    SetHandler server-status

    # 보안을 위해 로컬(exporter)에서만 접속 허용하거나 전체 허용(임시)
    Require all granted

    # 특정 아이피만 모니터링을 허용할 경우 사용
    # Require ip (ip주소)
</Location>
~/monitoring/docker-compose.yml
  apache-server:
    image: httpd:latest
    container_name: apache-server
    ports:
      - "80:80"
    volumes:
      - ./html:/usr/local/apache2/htdocs/
      - ./html/httpd.conf:/usr/local/apache2/conf/httpd.conf <= 해당 줄 추가
    restart: always
Docker 실행
docker compose up -dPrometheus 확인
먼저 Prometheus에서 apache-exporter와 fastapi 두개가 올라와있는지 확인합니다.
Prometheus 주소 (기본 포트)
http://localhost:9090

Grafana 작업
Grafana 주소 (기본 포트)
http://localhost:3000
계정 (비밀번호는 위에서 설정한 값입니다)
ID : admin
PW : admin
Prometheus를 추가하기 위해 Data sources 클릭

Add new data source 클릭

Prometheus 클릭

http://prometheus:9090 입력 후 저장
- Prometheus 서버가 외부에 있거나 포트가 다른경우 달라질 수 있습니다

왼쪽 상단 메뉴를 눌러 Dashboards 클릭

Import 클릭

3984 입력 후 Load
- 직접 만들 수도 있지만 여기서는 기존에 만들어져있는 대시보드를 사용하겠습니다.

Select a Prometheus data source 클릭하고 위에서 추가한 Prometheus 추가하고 Import 클릭

완성본
apache
대시보드 템플릿 사용 3894(Apache)

fastapi
대시보드 템플릿 사용 18739(FastAPI)

'Docker' 카테고리의 다른 글
| Docker 에 대해서 (0) | 2026.04.02 |
|---|